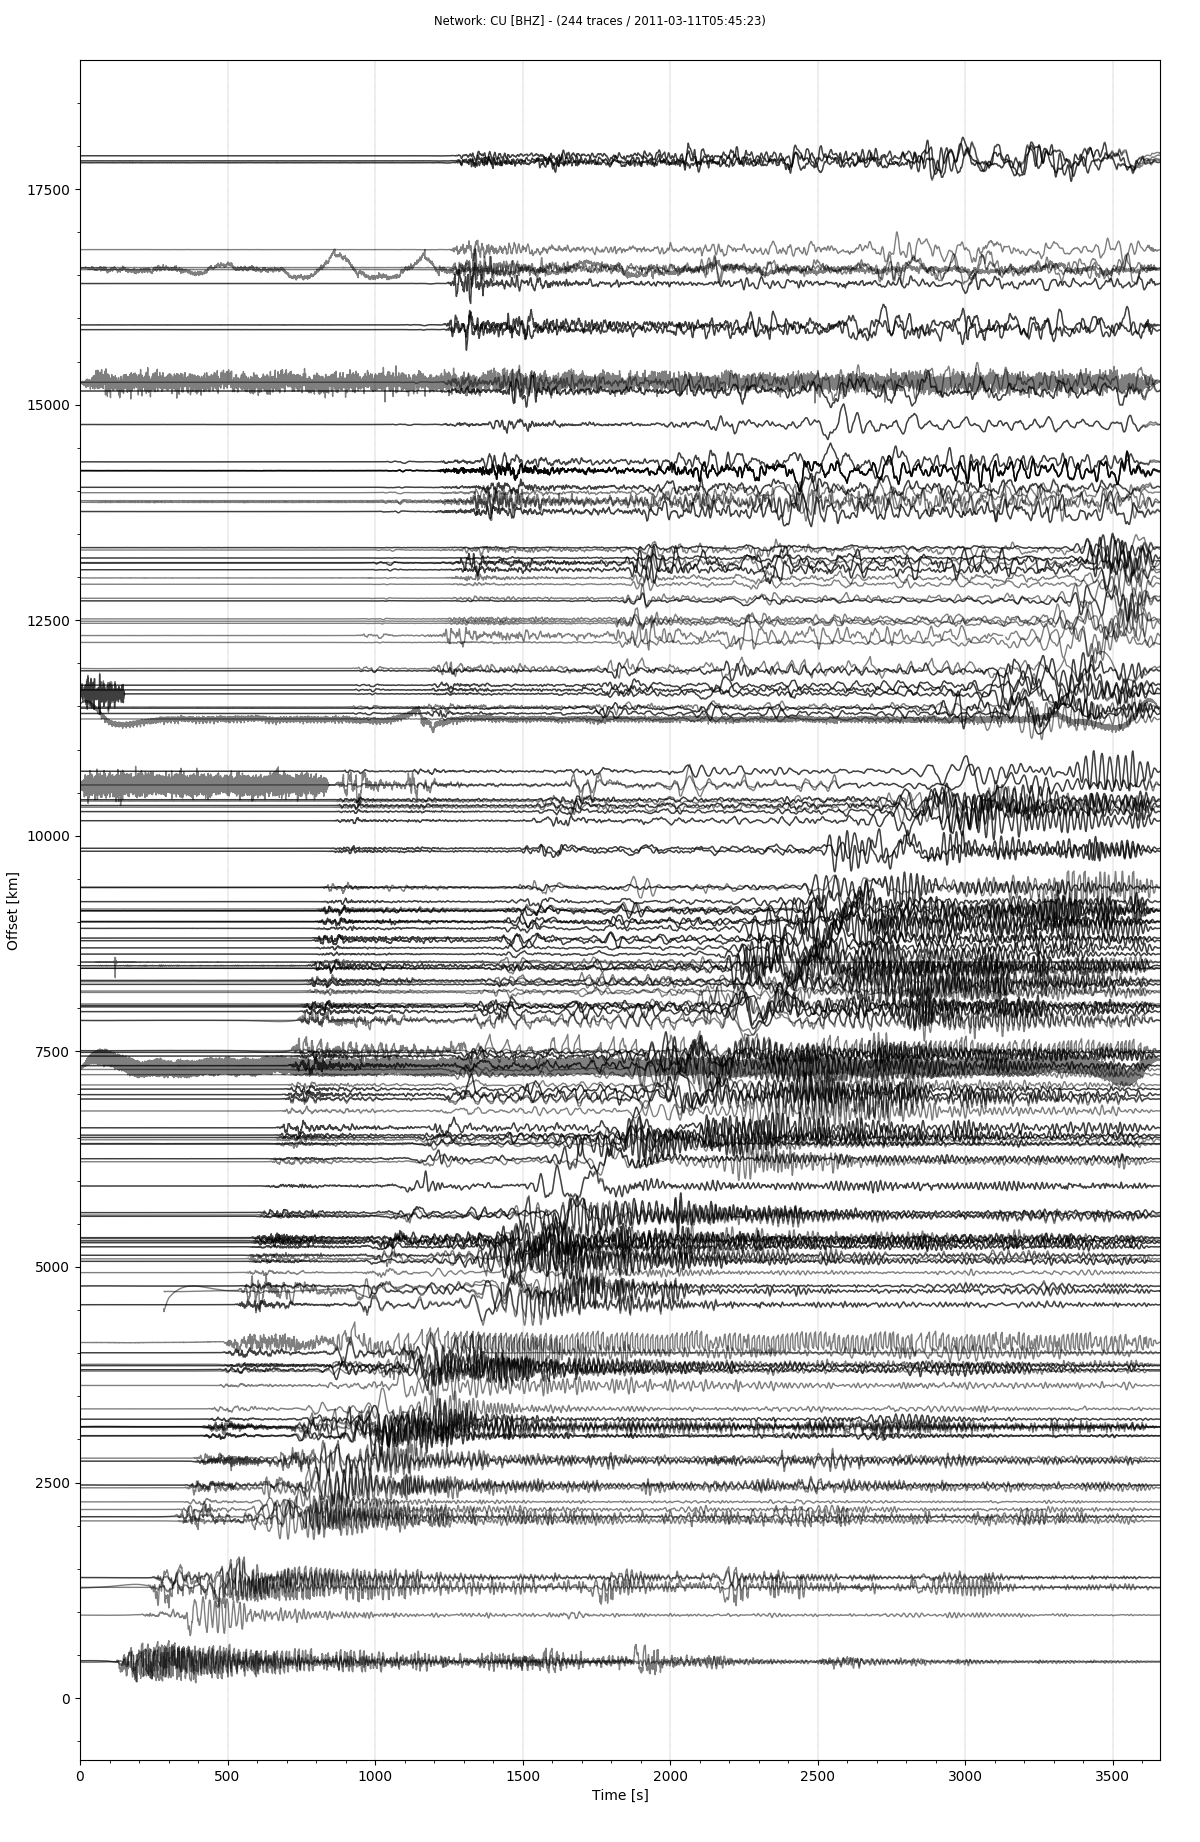
在前文1与前文2中介绍了使用 Obspy 读取地震记录与台站信息。本文继续介绍绘制通过从IRIS Wilber 3中下载的地震记录。
依赖
import os
import obspy
from geopy.distance import geodesic
from matplotlib import pyplot as plt
使用 geopy 计算台站与震中的距离。
参考 使用 get_file_list 函数获取 mseed 的文件列表。
读取文件,去除仪器响应并计算震中距
epicenter = [38.2963, 142.498]
file_list = get_file_list(local_folder, end=".mseed")
traceCollection = []
pre_filt = [0.001, 0.005, 10, 20]
for file_name in file_list:
	st = obspy.read(local_folder + file_name)
	for tr in st:
		if tr.stats.channel == 'BHZ':
			station_file_name = "IRISDMC-" + tr.stats.station + '.' + tr.stats.network + '.xml'
			tr_inv = obspy.read_inventory(local_folder + station_file_name)

			tr.remove_response(inventory=tr_inv, pre_filt=pre_filt)

			tr.data = tr.data

			coordinates = tr_inv.get_coordinates( tr.stats.network + '.'  + tr.stats.station+ '.'+ tr.stats.location + '.' + tr.stats.channel)

			latitude = coordinates['latitude']
			longitude = coordinates['longitude']
			station_location = [latitude, longitude]

			tr.stats['distance'] = geodesic(epicenter, station_location).m
			traceCollection.append(tr)

stZ = obspy.Stream(traceCollection)
先定义了从 IRIS 上查询的震中距坐标 epicenter;读取地震记录时筛选出 BHZ 通道的地震记录。
通过读取的台站记录与震中坐标计算震中距,写入 stats.distance中。
最后将读取的 trace 合并为一个 Stream。
绘图
stZ.plot(type='section', orientation='horizontal' , linewidth=1, grid_linewidth=.25, size=(1200,2000), scale=5., outfile='eq.png')
通过 stream.plot(type='section') 绘图。
设定如下:
scale=5.将振幅放大 $5$ 倍突出细节。outfile='eq.png'保存输出图片。orientation='horizontal'选择为竖向输出。
输出:

