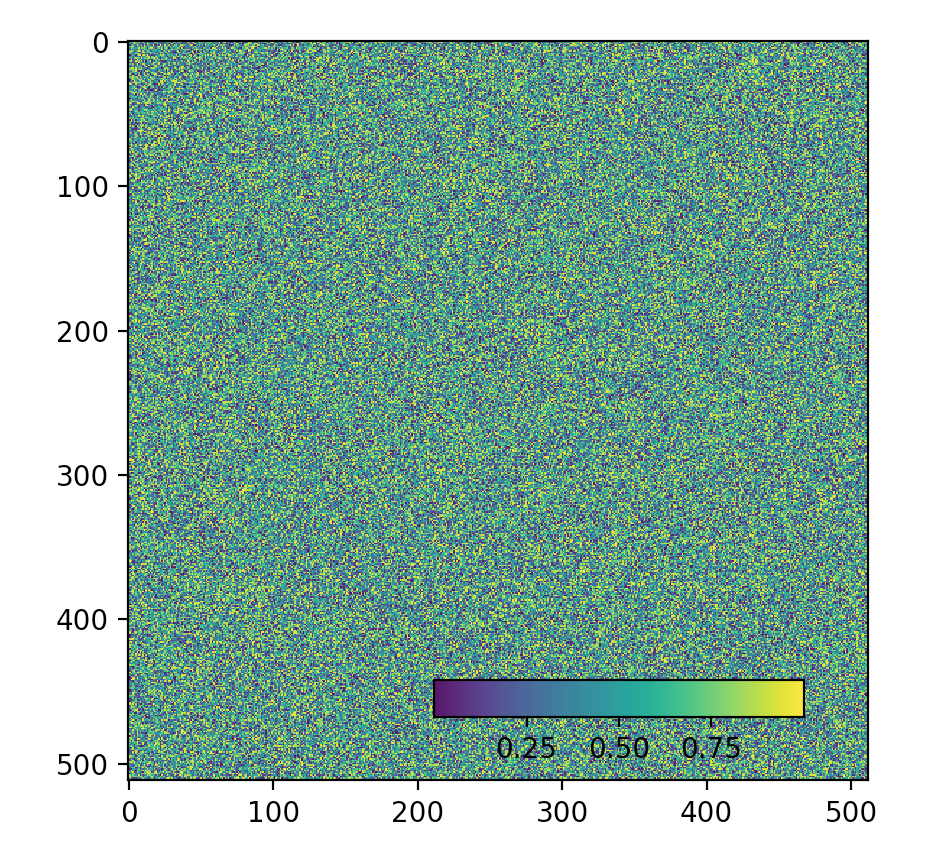
plt.colorbar的绘制默认放置在图片的右侧中间,本文将介绍几种colorbar的微调方法,包括上下左右放置、内置、以及偏心放置的方法。
例子
我们以一张 $512\times512$ 的随机图像为例:
import numpy as np
import matplotlib.pyplot as plt

img = np.random.random([512,512])
pcm=plt.imshow(img)

# append a colorbar
plt.colorbar(pcm)

plt.show()
默认生成的 colorbar 在右侧中间。
纵向/横向放置并挪动到内部
使用 orientation='horizontal'参数,可以将 colorbar 移动到下方(默认:vertical):
plt.colorbar(pcm, orientation='horizontal')
届时可以使用 pad 参数上下(对于orientation='horizontal',默认0.15)或左右(对于orientation='vertical',默认0.05)微调 colorbar 位置,例如:
plt.colorbar(pcm, orientation='horizontal', pad=-0.15, shrink=0.5)
这里使用 shrink 参数将 colorbar 适当缩小,以适应imshow窗体内部大小。
上下左右放置
高版本的 matplotlib (>=3.4)则可以使用 location 参数进行上下左右选择,例如:
plt.colorbar(pcm, location='bottom')
可选参数:left、 right、top 和 bottom,分别对应左右上下。
浮动内置,可以自由灵活选择
使用 inset_axes 创建一个 ax 内小窗体,并作为colorbar:
from mpl_toolkits.axes_grid1.inset_locator import inset_axes

# append an inset_axis
axins = inset_axes(plt.gca(), width="50%",  height="5%", loc='lower right', borderpad=2.3)
plt.colorbar(pcm, cax=axins, orientation='horizontal')
这里使用plt.gca() 自动获取当前 ax,在实际使用时可根据需要修改;首先创建了一个宽度为当前 ax一半,高度为 5% 的子窗体,放置右下角的位置,并使用 borderpad 与窗体边缘保留一些距离。之后在该子窗体上绘制横向的colorbar。
完整代码
import numpy as np
import matplotlib.pyplot as plt
from mpl_toolkits.axes_grid1.inset_locator import inset_axes

img = np.random.random([512,512])
pcm=plt.imshow(img)

axins = inset_axes(plt.gca(),width="50%",  height="5%",loc='lower right', borderpad=2.3)
plt.colorbar(pcm,cax=axins,orientation='horizontal')

plt.show()

